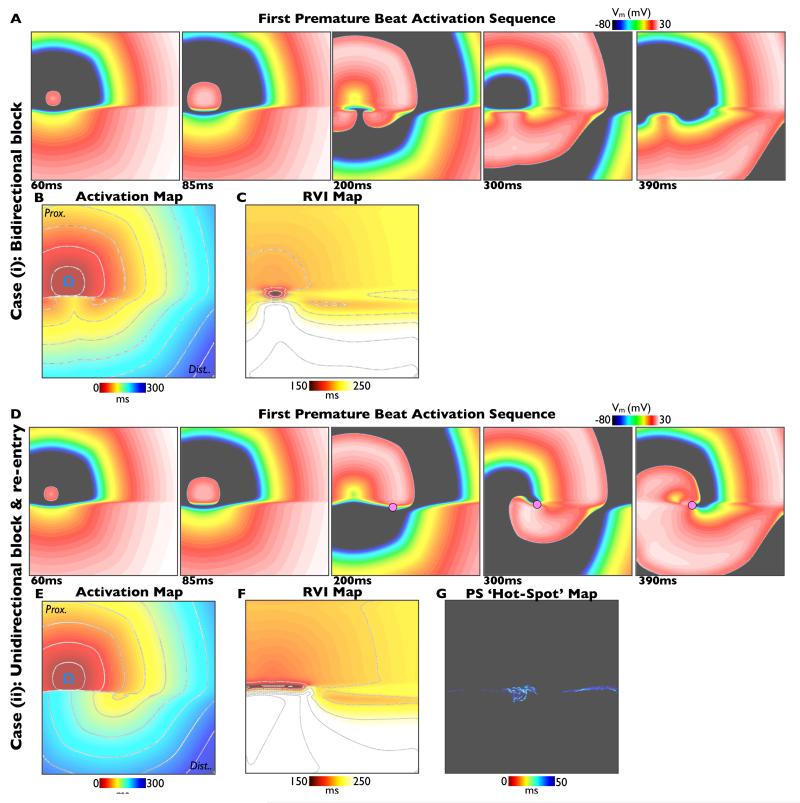
Figure 5. Computational simulations.
Simulations of premature S2 beats in the cases of bi-directional block (S2 interval 350ms, upper panels) and uni-directional block and re-entry (S2 interval 340ms, lower panels). In each case activation sequences (A, D), activation maps (B, E) and calculated RVI maps (C, F) are shown. Phase singularities are shown as pink circles in panel D. In the case of re-entry, a ‘hot-spot’ map showing cumulative spatial phase singularity locations is shown (panel G).

