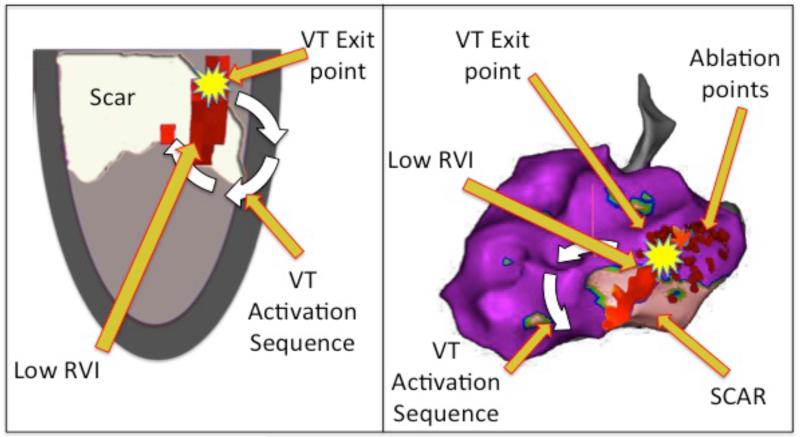
Figure 8. Correlation of RVI with VT.
Left – Diagrammatic representation showing superimposed scar (white), activation sequence (white arrow) and area of low RVI (dark red area) co-localizing with VT exit point (yellow). Right – Carto geometry with the same features displayed on the left lateral projection of the 3D geometry. Small red dots show areas of endocardial ablation which resulted in termination and non-inducibility of the VT. White arrow represents the direction of circuit on leaving the exit point deduced from the activation map (Figure S7).

