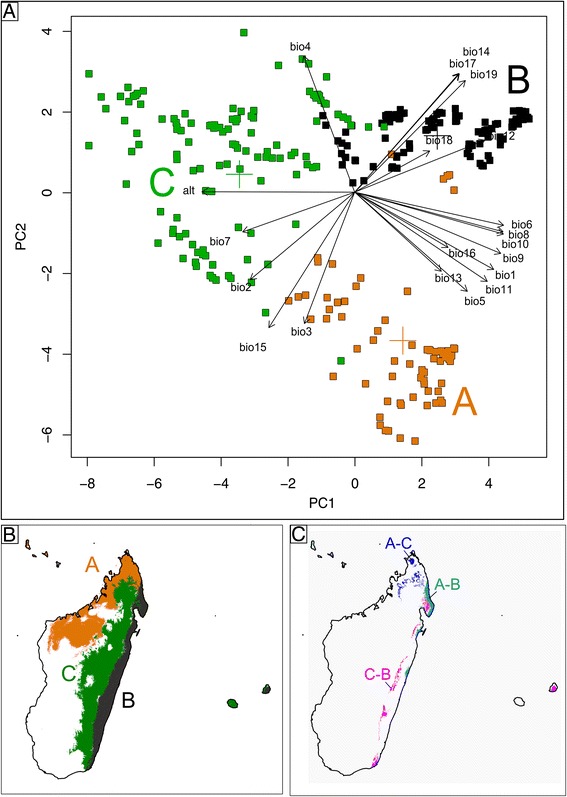
Fig. 2.

Macroecological clusters viz. niches (A, B, C) of Bulbophyllum clade C from Madagascar and adjacent islands (Comores, La Réunion, Mauritius). a Principal component analysis (PCA) biplot of 604 occurrence data (squared symbols) of clade C species (plus three outgroup species) based on 19 bioclimatic variables (bio 1–19) and altitude (alt). Each data point is coloured according to its hard cluster membership as defined by fuzzy C-means (FCM) clustering. Coloured crosses indicate centroids. (Note: the factor loadings do not correspond to the x or y axes, see [Additional file 2] for factor loadings). b Binary ecological niche models (ENMs) for clusters A, B, and C using a maximum training sensitivity plus specificity logistic threshold. c Range overlap between the ENMs of clusters (A–B, A–C, C–B) based on the same threshold
