
Fig. 2.
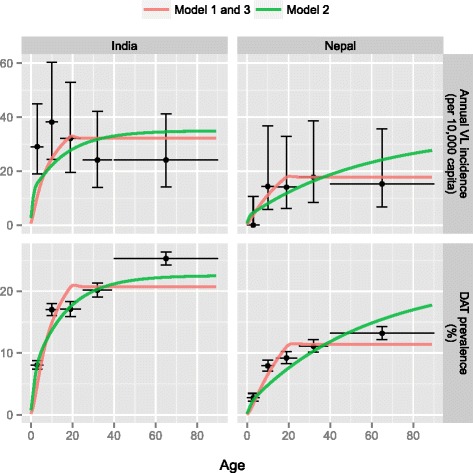
Predicted and observed age-patterns in VL incidence and DAT prevalence in India and Nepal. Coloured lines represent model predictions from the sub-variant of each of the three models that best fit age-patterns in human infection markers; black bullets represent the data per age group; horizontal lines indicate the age range for each data point; vertical lines represent 95 %-Bayesian credible intervals, given total raw sample sizes (i.e. not accounting for clustering, see Additional file 1 for sample sizes). See Additional file 2 for illustrations of the fit of all model sub-variants to all data types