
Fig. 4.
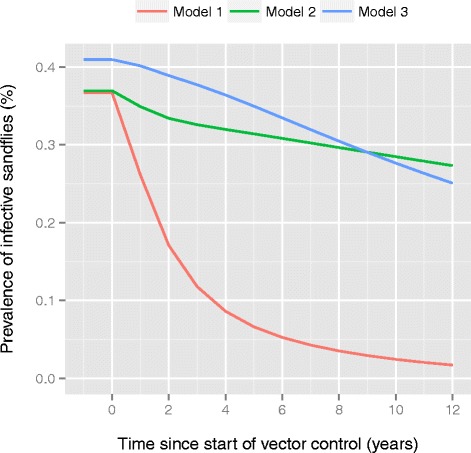
Predicted prevalence of infective sandflies during IRS. Pre-IRS prevalence levels of infective sandflies represent a setting with 10 annual VL cases per 10,000 capita. IRS is assumed to start in the year zero, and to be implemented optimally (63 % reduction in sandfly density). The three colored lines represent the sub-variant of each of the three models that best fit age-patterns in human infection markers. See Additional file 4 for low, medium and highly endemic settings with optimal and sub-optimal IRS