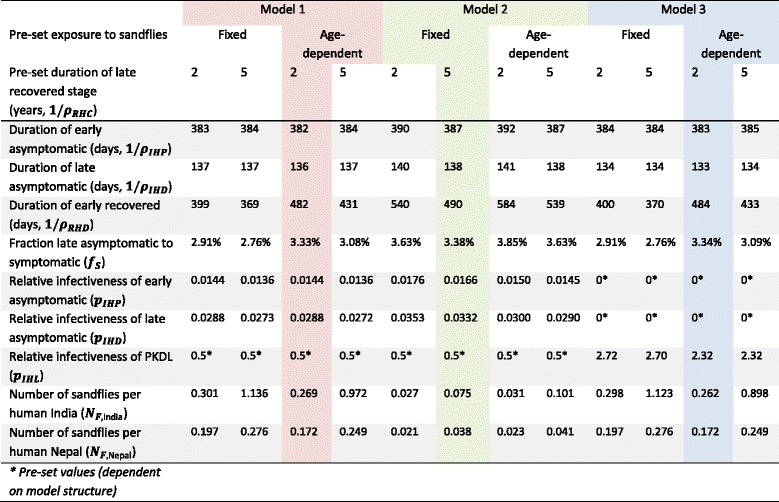
Table 2.
Quantified parameter values of the twelve model variants

The colours represent the model sub-variants that best reproduced the age-structured prevalence and incidence data. See Additional file 2 for illustrations of fitting of all model variants to all data and Fig. 2 for the predicted and observed age-patterns in VL incidence and DAT prevalence in India and Nepal with the selected model variants
