
Fig. 4.
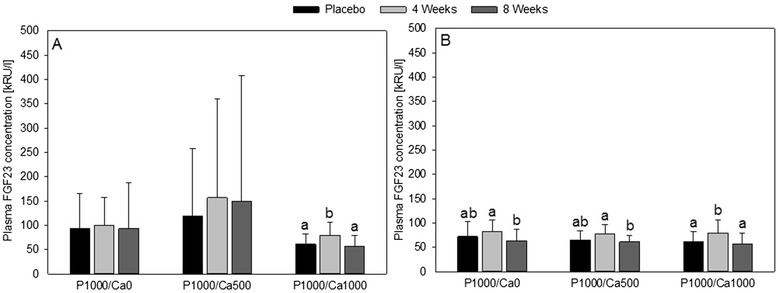
Plasma concentrations of fibroblast growth factor 23 after nutritional intervention with phosphorus and calcium. a n = 61 all subjects; (b) n = 56 subjects with concentrations above 300 kRU/l in at least one study period; data are expressed as mean + standard deviation; FGF23: fibroblast growth factor 23; mean values within an intervention group with dissimilar superscript letters are significantly different (p ≤ 0.05); mean values without superscripts have no significant differences; effect of time was tested using general linear model with repeated measurements (with pairwise comparisons based on Bonferroni); effect of supplementation was tested using univariate analysis of variance followed by Bonferroni post hoc test; P1000/Ca0: 1000 mg phosphorus/0 mg calcium; P1000/Ca500: 1000 mg phosphorus/500 mg calcium; P1000/Ca1000: 1000 mg phosphorus/1000 mg calcium