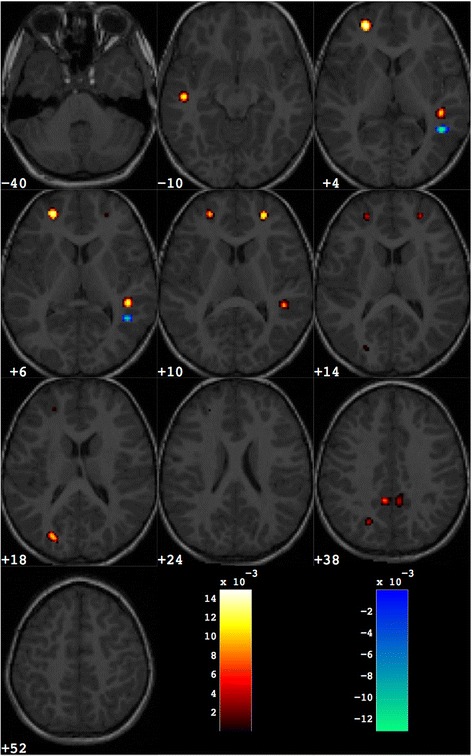
Fig. 2.

Discrimination map obtained for the entire group of male and female subjects. About 1000 voxels are retained out of the total amount of grey matter voxels (more than 500,000). The map is overlaid to a representative structural MR image. The regions in red scale represent the brain areas where grey matter is greater in group with ASD with respect to controls; the regions in blue scale are referred to the opposite contrast
