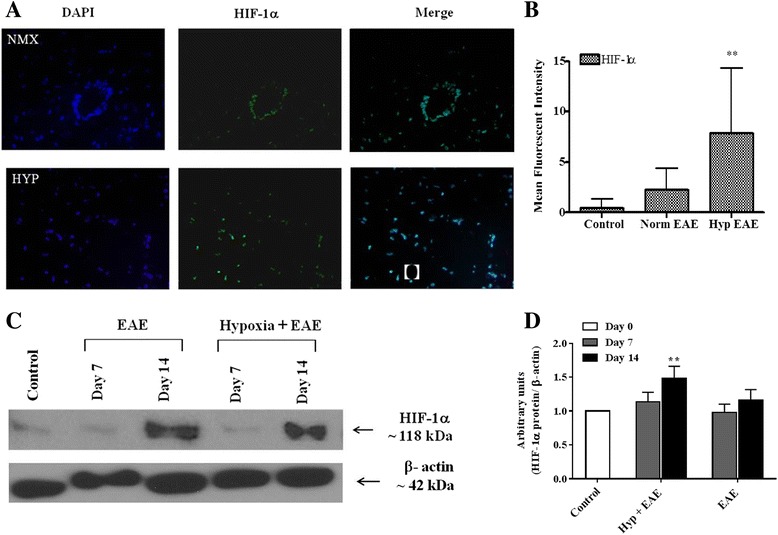
Fig. 3.

HIF-1α expression was induced both in hypoxia-treated and normoxic EAE animals. a Flash-frozen spinal cord sections of both hypoxic and normoxic EAE mice (n = 3/group) at peak disease were prepared as mentioned in the “Materials and methods” section and subjected to immunofluorescence staining for HIF-1α (green) and DAPI (blue, for nuclei). To show the distribution differences, pictures of ×10 magnification were presented. Results are representative of two independent experiments. b Mean fluorescent intensity of HIF-1α-stained sections were quantified using ImageJ program, and the graphs represent the mean of fluorescent intensity from 10 to 14 areas per group (mean ± SD). Significant differences between hypoxia-exposed and normoxic EAE mice are denoted with asterisks (**p < 0.01). c Spinal cord protein extracts were prepared at the indicated days post-immunization and analyzed for HIF-1α expression by Western blotting as described in the “Materials and methods” section. To compare the baseline expression of HIF-1α, naïve spinal cord was also included. Membranes were stripped and re-probed with β-actin. Results are representative of three samples/time point/group. d WB films (n = 3/group) were scanned, and the intensity of bands was quantified using ImageJ program. The graph shows the relative expression of HIF-1α in the groups following normalization first to its β-actin band and then to the control group. Asterisks denotes the significant differences between hypoxia-exposed EAE mice and the control mice (**p < 0.01)
