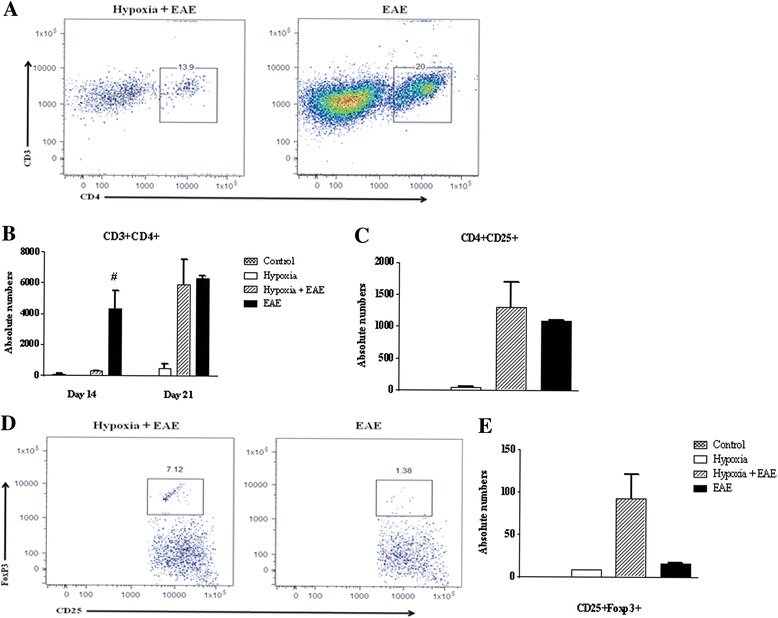
Fig. 5.

CD4+ T cells were less in the hypoxic EAE spinal cords at day 14. Immune cells were recovered from mice (three animals/group/time point) at days 7 and 14 following MOG immunization as described in the “Materials and methods” and analyzed by FACS. Gating was done first on the CD11b-CD45hi cells and then further plotted for CD3, CD4, and CD25 expressions (a). Total numbers of CD3+CD4+ (b) and CD4+CD25+ (c) cells in the spinal cords were presented (mean ± SD). A representative dot plot of CD4+CD25+FoxP3+ (d) and the absolute numbers (e) are presented (mean ± SD). Significant differences between hypoxia-exposed and normoxic EAE mice are denoted with pound sign (# p < 0.05)
