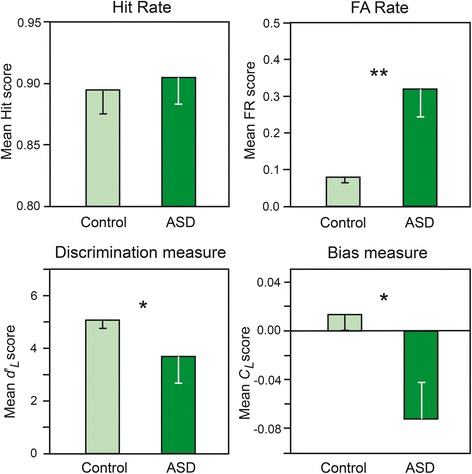
Fig. 1.

Suprathreshold detection. Representation of Hit rates (HR), FA rates (FR), and discrimination (d’ L), and bias (C L) measures as a function of group (control vs. ASD). The vertical bars represent the standard errors of the mean.*p < 0.05; **p < 0.01. ASD autism spectrum disorders, FA false-alarm
