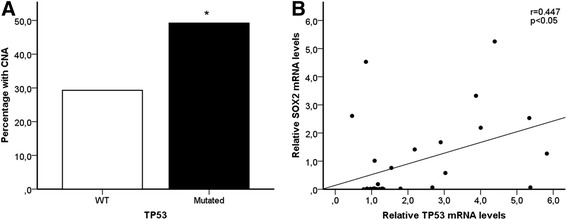
Fig. 2.

a TP53 gene status in tumor tissue of patients and its association with copy number alterations (CNA) in the SOX2 gene. **p = 0.017, was obtained from unconditional logistic regression, adjusted for age, gender, total pack-years and histology (n = 229). b Correlation between the relative SOX2 and TP53 mRNA expression. r = 0.447, p = 0.013 was obtained from Spearman's Rank-Order Correlation (n = 30)
