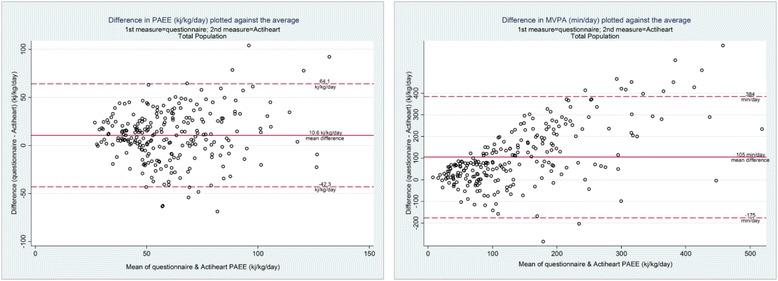
Fig. 1.

Bland-Altman plots of the difference vs. the mean of physical activity energy expenditure and moderate/vigorous physical activity reported in the APCAPS-PAQ and measured using the Actiheart

Bland-Altman plots of the difference vs. the mean of physical activity energy expenditure and moderate/vigorous physical activity reported in the APCAPS-PAQ and measured using the Actiheart