Fig. 6.

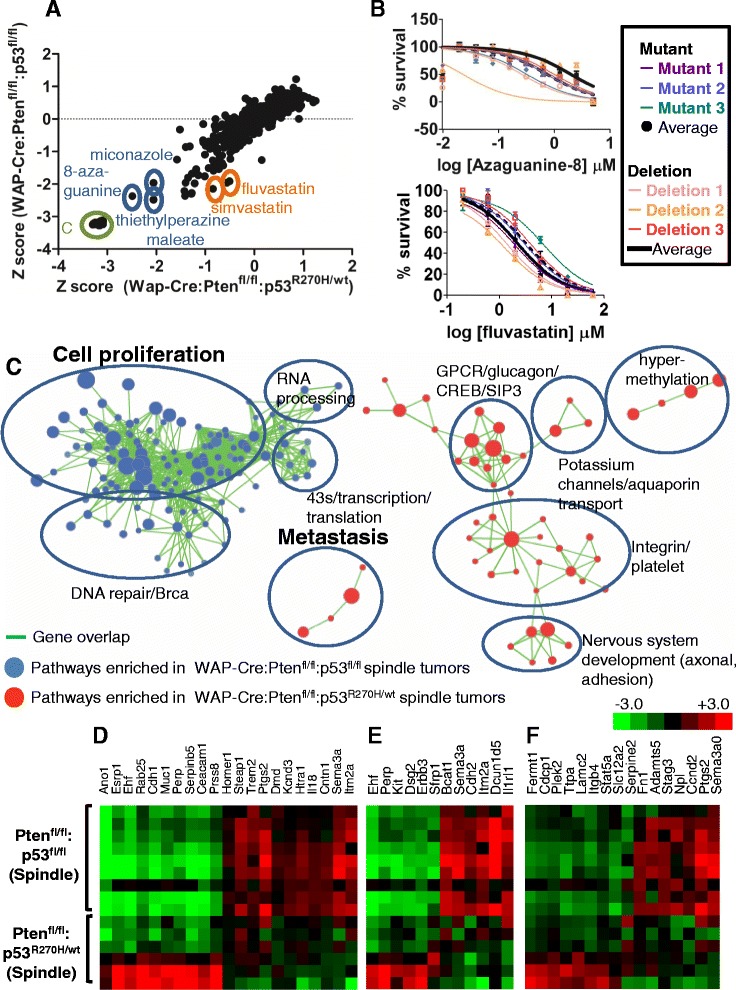
HTP screens and GSEA reveal similarities and differences between Pten∆f:p53R270H and Pten∆f:p53∆f mammary tumors. a Average response of three independent primary tumor lines from WAP-Cre:Ptenfl/fl:p53R270H/wt mice vs. three independent primary tumor lines from WAP-Cre:Ptenfl/fl:p53fl/fl mice to 1120 FDA-approved small molecules. Highlighted are C (no cells negative control), 8-azaguanine, miconazole, thiethylperazine malate, fluvastatin and simvastatin. b Dose–response curves for 8-azaguanine (average IC50 = 0.53 μM; top) and fluvastatin (IC50 = 0.52 μM for mutant lines; IC50 = 0.34 μM for deletion lines; bottom) using MTT viability assay. c GSEA showing selected pathways enriched in claudin-low-like WAP-Cre:Ptenfl/fl:p53R270H/wt (red) versus pathways enriched in WAP-Cre:Ptenfl/fl:p53wt/wt (blue) tumors. Green lines connect overlapping pathways. Proliferation and metastasis pathways are highlighted. d-f Heat map showing expression of metastasis (d), proliferation (e) and DNA repair (d) genes in Pten∆f:p53R270H vs. Pten∆f:p53∆f spindle-like tumors. HTP high-throughput, GSEA, gene set enrichment analysis
