
Fig. 4.
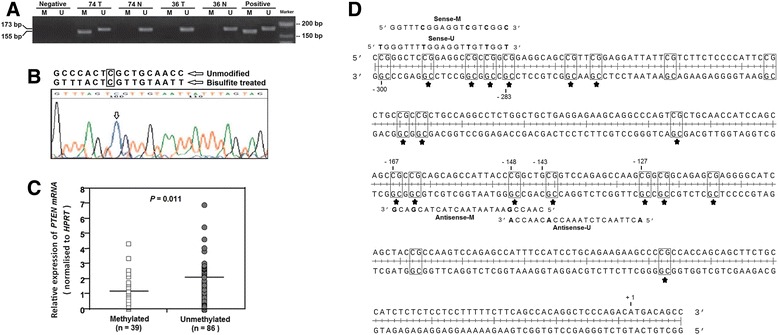
Representative results of MSP analysis of the PTEN gene in CRC patients. a The Methylation status was determined based on Product size-band; 176 bp for unmethylated and 155 bp for methylated. Universal methylated and unmethylated DNA was used as a positive control. Water was used as a negative control. N, normal tissue; T, tumor tissues; M, methylated; U, unmethylated. b Bisulfite sequencing of the PTEN promoter was performed using primers of methylation analysis on the methylated samples. Bisulfite sequencing results indicated that the sequence shown in the electropherograms matched the PTEN gene at the one critical nucleotide positions (marked with arrows and box). c The level of PTEN mRNA in methylated samples was significantly lower than unmethylated samples. Horizontal lines indicate the mean values. Differences between groups were analyzed using the Student’s t-test. d Part of the PTEN promoter region. +1 indicates the translation start site and the location of the primer set is marked using number. Differences between unmethylated and methylated sequences on primers are shown in bold. The CpG sites are in box and common methylated sites in all methylated samples are marked by asterisk