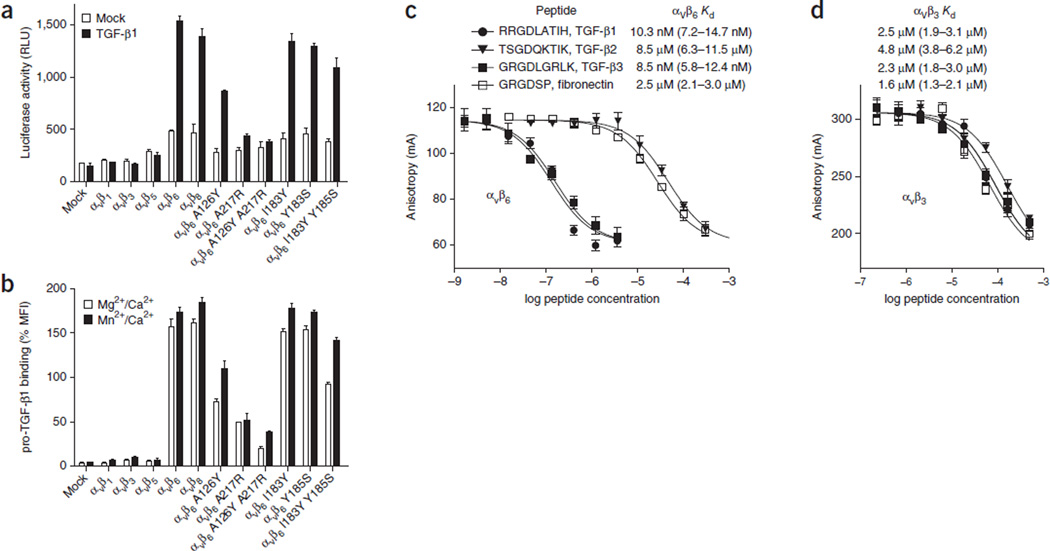
Figure 1.
Activation and binding of pro-TGF-β1 by wild-type and mutant αV integrins. (a) Indicated HEK293T transfectants assayed for TGF-β1 activation with mink lung luciferase reporter cells, measured as relative light units (RLU). Mock, control mock transfection. (b) Saturation binding of FITC–pro-TGF-β1 to HEK293T transfectants, shown as percentage mean fluorescence intensity (% MFI) of αV P2W7 monoclonal antibody binding. Slashes denote ‘and.’ (c,d) Binding of peptides to αVβ6 (c) or αVβ3 (d) headpieces, measured by fluorescence anisotropy. Anisotropy is measured as millianisotropy units (mA), as (F‖ – F⊥)/(F‖ + 2F⊥) × 1,000, where F‖ is the fluorescence intensity parallel to the excitation plane, and F⊥ is the fluorescence intensity perpendicular to the excitation plane. Data show mean ± s.e.m. of technical triplicate samples. Peptides at the indicated concentrations were used with 200 nM αVβ6 or 4 µM αVβ3 headpiece and 5 nM of fluorescent peptide probe. Kd was calculated from IC50 as described30.

