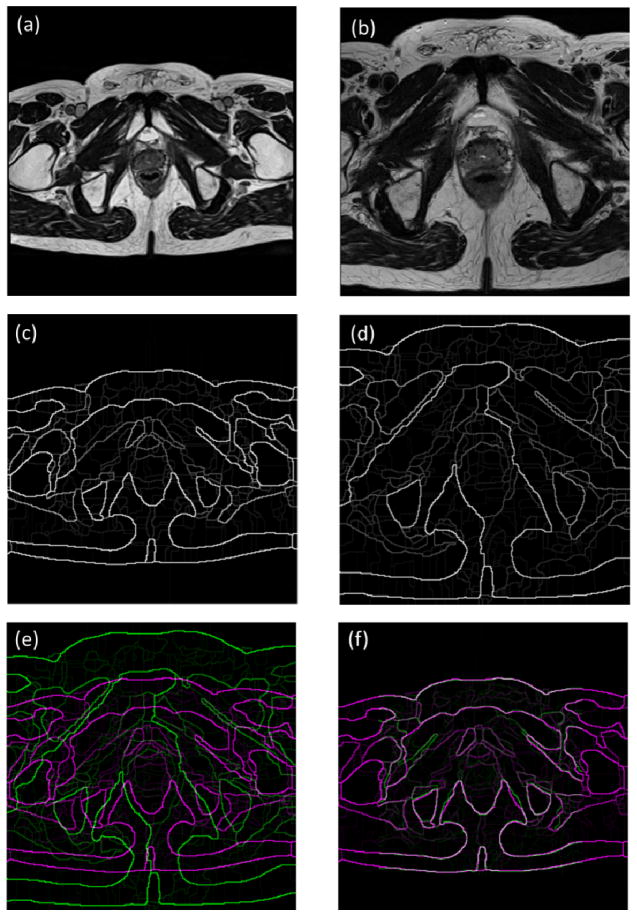
Figure 2.
The demonstration of the edge maps of MR images. (a) The target image. (b) The atlas image. (c) The edge map of the target image. (d) The edge map of the atlas image. (e) Two edge maps are superposed before registration. (f) Two edge maps are superposed after registration. Gray areas correspond to areas that have similar intensities, while magenta and green areas show places where one image is brighter than the other.

