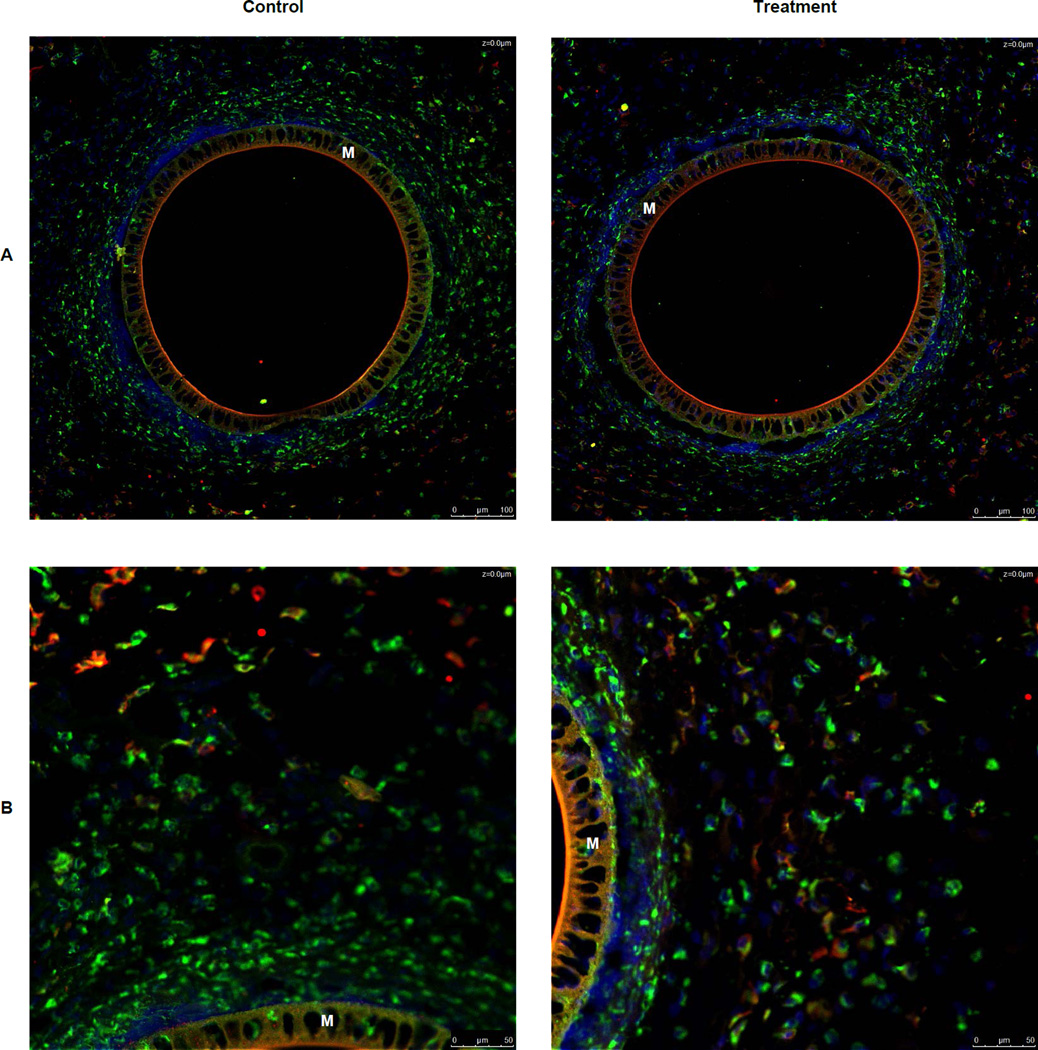
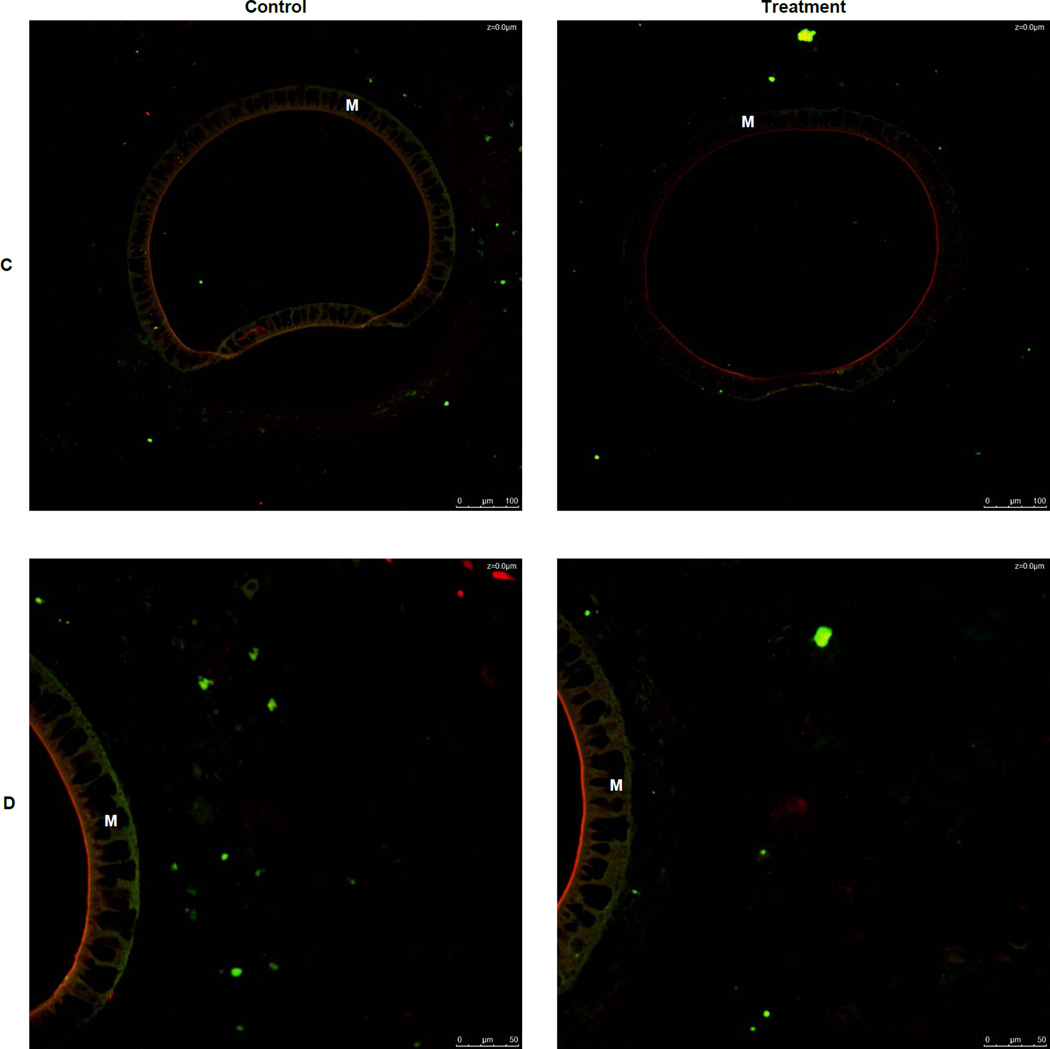
Figure 3.
Immunohistochemical staining for CD 68 (green), CD 163 (red), and nuclei (blue) in tissue surrounding a microdialysis probe. Overlapping colors represent M2c macrophages. A) Images of both control and treatment tissue surrounding a microdialysis probe membrane. 20× Magnification B) Images of both control and treatment tissue surrounding a microdialysis probe membrane. 40× Magnification C) Images of isotype controls at 20× Magnification D) Images of isotype controls at 40× Magnification M indicates the microdialysis probe membrane Scale bars in lower right of each image represent 100 µm


