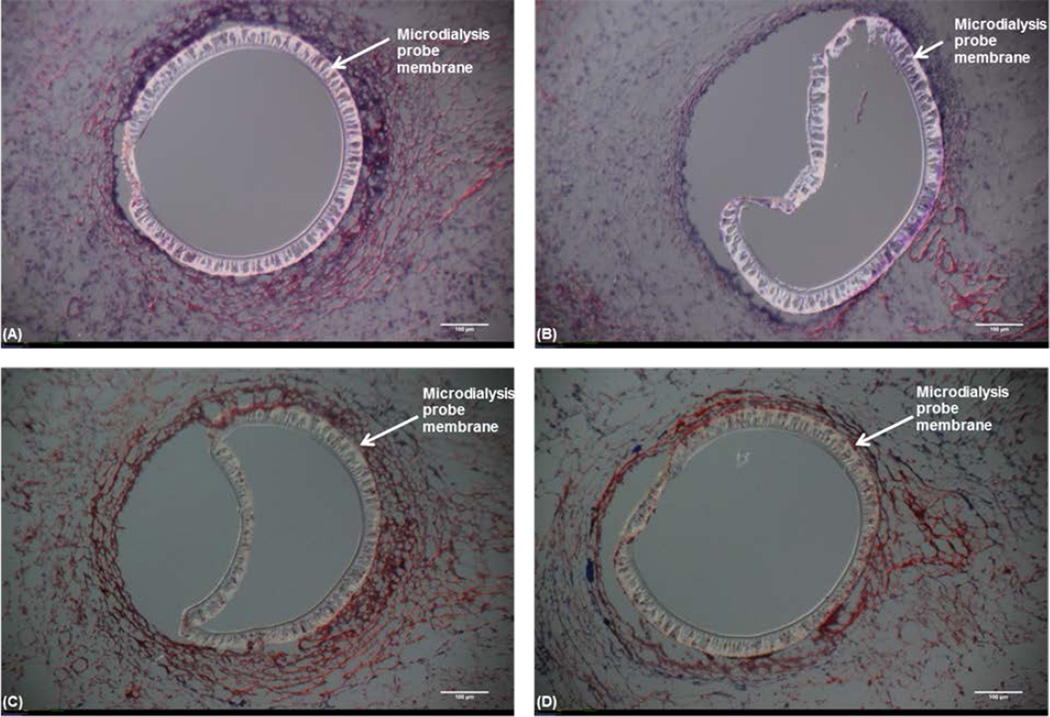
Figure 5.
Hematoxylin and Eosin (H&E) and Masson’s Trichrome staining of the tissue surrounding the microdialysis probe implanted into the subcutaneous space.Top: (H&E) stained tissue (nuclei – blue, eosinophilic structures - red, basophilic structures – purple and erythrocytes – bright red) (A) Control microdialysis probe. (B) Treatment microdialysis probe (20 µg/mL Dex). Bottom: Masson's Trichrome stained tissue (nuclei – dark brown/black, cytoplasm -light red/pink and collagen – blue). (C) Control microdialysis probe. (D) Treatment microdialysis probe (20 µg/mL Dex). Images are 10× magnification with 100 µm scale bar and are representative of tissue where tissue sections were obtainable.

