
Figure 3.
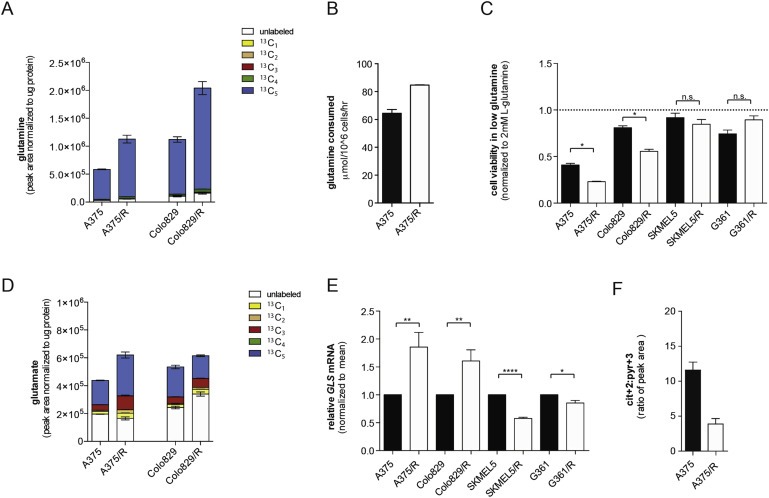
BRAF inhibitor resistant melanoma cells show increased glutamine metabolism. (A) Graph showing intracellular glutamine levels in A375, A375/R, Colo829 and Colo829/R cells labeled with U‐13C5 glutamine. Legend displays isotopomer distribution. 13C1: one carbon atom labeled; 13C2–13C5: two to five carbon atoms labeled. Glutamine is a 5‐carbon molecule hence 13C5 labeling (blue). Endogenous glutamine is unlabeled and shown in white. (B) Graph showing glutamine consumption (extracellular exchange rates) in A375 and A375/R cells. Data are representative of three independent studies and displayed as mean ± SD of n = 6. (C) Graph showing growth (sulforhodamine B) of A375, A375/R, Colo829, Colo829/R, SKMEL5, SKMEL5/R, G361 and G361/R cells in medium containing 0.5 mM glutamine for 72 h. Data are presented relative to medium containing 2 mM glutamine. Error bars represent SEM of three independent experiments with 3 biological replicates. *p < 0.05, ns: non‐significant. (D) Graph showing intracellular glutamine levels in A375, A375/R, Colo829 and Colo829/R cells labeled with U‐13C5 glutamine. Data are a representative experiment of mean ± SD of n = 6. Similar results were observed in two independent experiments. Legend displays isotopomer distribution. 13C1: one carbon atom labeled; 13C2 to 13C5: two to five carbon atoms labeled. Glutamate is a 5‐carbon molecule hence 13C5 labeling (blue). Endogenous glutamate is unlabeled and shown in white. (E) Graph showing GLS mRNA levels in A375, A375/R, Colo829, Colo829/R, SKMEL5, SKMEL5/R, G361 and G361/R cells. Three independent experiments with n = 3 were performed and results display mean ± SEM. *p < 0.05, **p < 0.01, and ****p <0.0001. (F) Ratio of intracellular citrate (Cit+2) to pyruvate (Pyr+3) in A375 and A375/R cells.