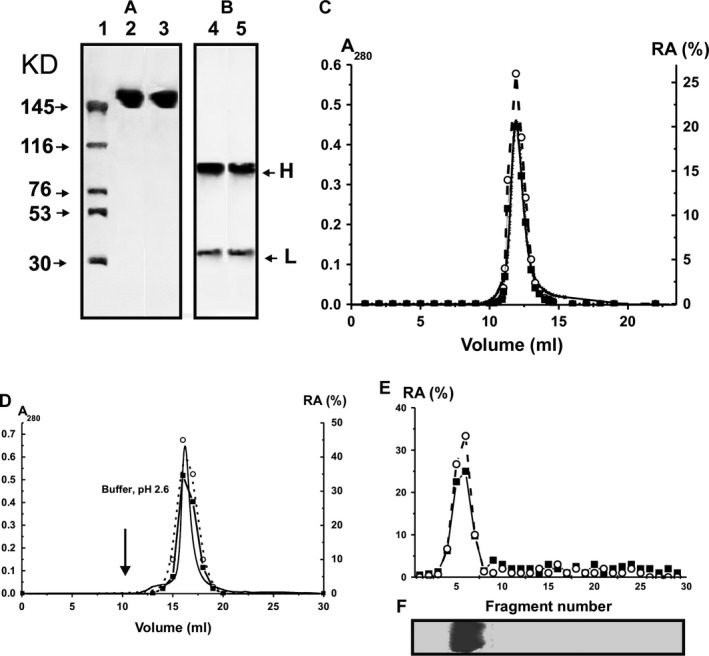
Figure 2.

SDS‐PAGE analysis of the homogeneity of untr‐IgGmix and tr‐IgGmix (7 μg) under non‐reducing (A, lanes 2 and 3, respectively) and reducing (B, lanes 4 and 5) conditions followed by silver staining; the arrows (A, lane 1) indicate the positions of molecular mass markers. FPLC gel filtration of tr‐IgGmix on a Superdex 200 column in an acidic buffer (pH 2.6) after Abs incubation in the same buffer (C), affinity chromatography on Sepharose bearing rabbit IgGs against mouse IgGs (D) and SDS‐PAGE isolation of tr‐IgGmix (E and F): (—), absorbance at 280 nm (A280); relative activity (RA) of in the hydrolysis of DNA (○) and MBP (■).The relative DNase‐ and MBP‐hydrolysing activity (%) was revealed using the extracts of 2–3 mm fragments of one longitudinal slice of the gel (E). (F) It shows the position of IgGs after electrophoresis. A complete hydrolysis of substrates for 24 hrs was taken for 100% (C–E). The error in the initial rate determination from two experiments in each case did not exceed 7–10%. For other details, see Materials and methods.
