Figure 4.

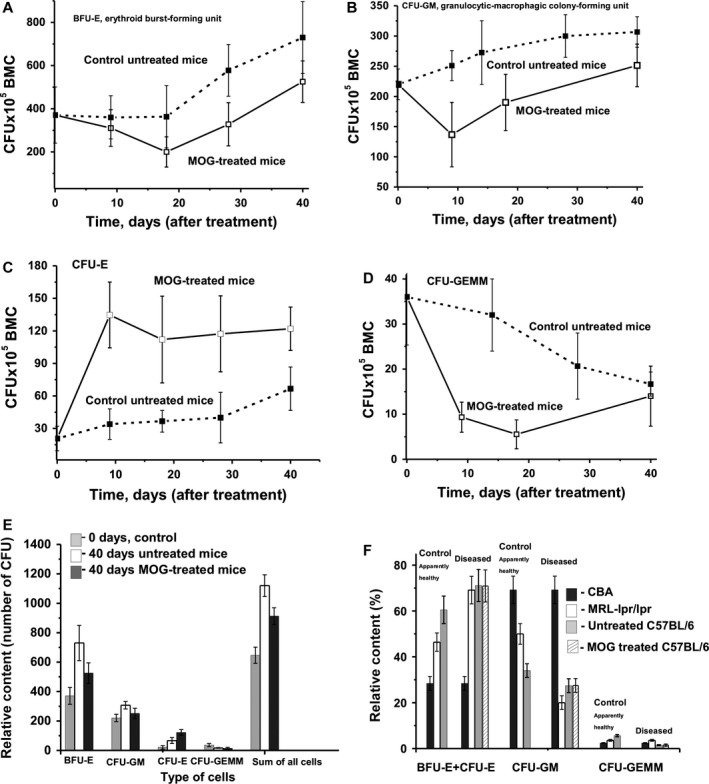
In time changes of an average relative content of colony‐forming units (CFU) of bone marrow progenitor colonies (BMC) of different type in the case of untreated and MOG‐treated mice; average number of the colonies corresponding to seven mice of each group is given and types of progenitor colonies are shown on A–D. (E) It demonstrates the relative profile of differentiation of bone marrow progenitors (relative number of colonies of different type) at the beginning of experiment (zero time, control) and after 40 days for untreated and MOG‐treated mice. In addition, the relative content of all type of progenitor colonies (their sum) is given. The relative content (%) of total erytroid cells (BFU‐E+ CFU‐E), CFU‐GM and CFU‐GEMM colonies in the case of healthy CBA, conditionally healthy MRL‐lpr/lpr and C57BL/6 mice at 3 months of age, after development of respectively EAE and SLE is shown (F). For C57BL/6 mice the relative contents of progenitor colonies after spontaneous and MOG‐stimulated development of EAE are given. For other details, see Materials and methods.
