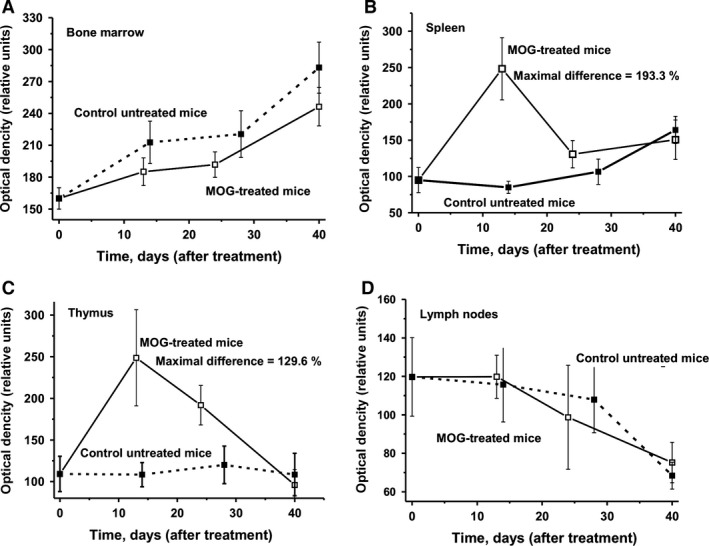
Figure 5.

In time changes in lymphocyte proliferation (optical density) in bone marrow (A), spleen (B), thymus (C) and lymph nodes (D); in the case of untreated and MOG‐treated mice average values corresponding to seven mice of each group is given. The error in the lymphocyte determination from three independent experiments in the case of every mouse of each group did not exceed 7–10%. For other details, see Materials and methods.
