
Figure 2.
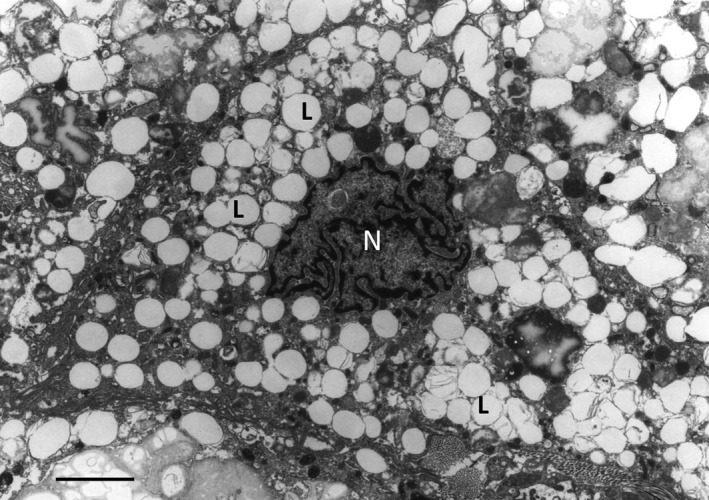
Electron micrograph showing a macrophage foam cell, the cytoplasm of which filled with a large number of ‘lipid droplets’ (L). N – nucleus. Atherosclerotic plaque tissue specimen of the human aorta. Transmission electron microscopy (TEM); scale bar = 5 μm.