
Figure 3.
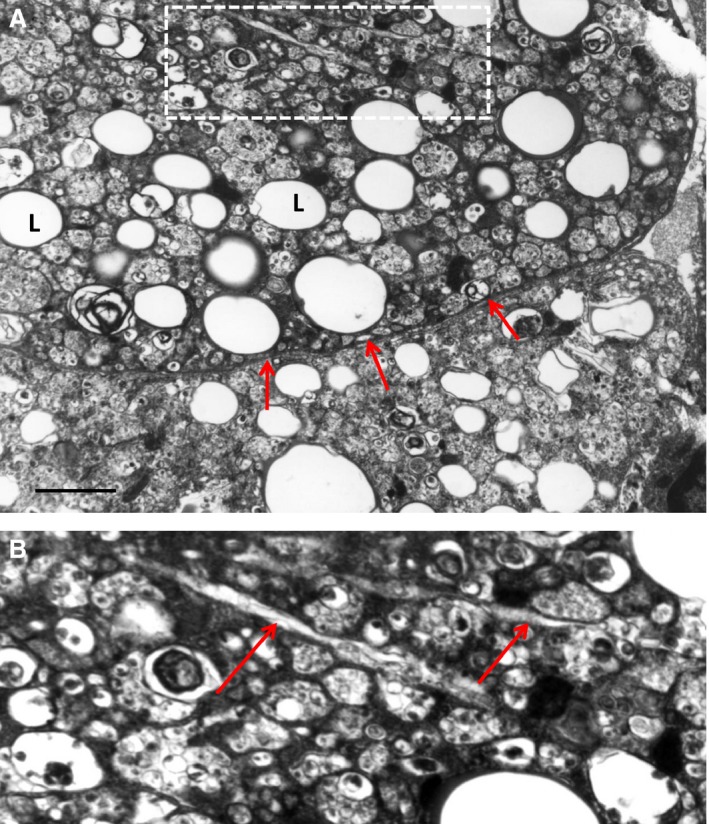
Formation of cholesterol crystals in the cytoplasm of a foam cell (A and B). (B) It is a detail of (A). L ‐ ‘lipid droplet’. In (A), arrows show the plasma membrane of the foam cells. In (B), arrows show cholesterol crystals. Atherosclerotic plaque tissue specimen of the human aorta. TEM; scale bar = 1 μm (A).