
Figure 6.
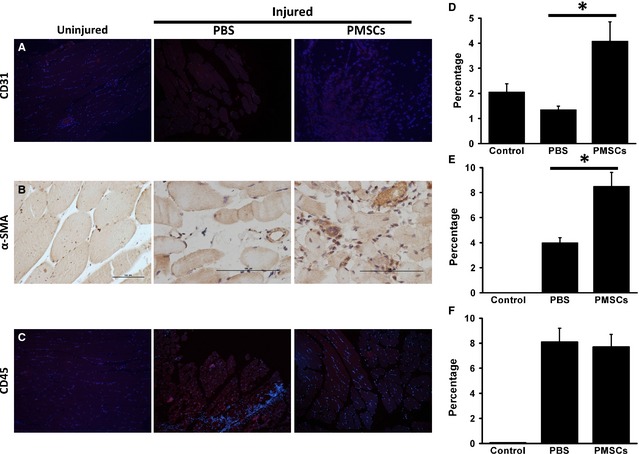
The differentiation ability of PMSCs in ischemic limbs. (A) Representative images of endothelial differentiation with CD31+ staining. (B) Smooth muscle differentiation with α‐SMA + staining. (C) Inflammation with CD45+ staining. Quantitative measurement was expressed as percent of positive staining versus total per muscle area (D–F). Data were presented by mean ± SD, *P < 0.05.