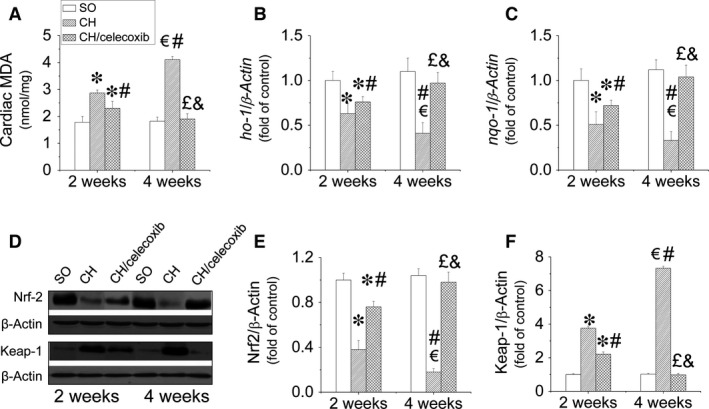
Figure 8.

Celecoxib‐induced anti‐oxidative effects in the hypertrophic heart. Cardiac tissues from all three groups were collected at the indicated times to measure cardiac oxidative stress (A), and the gene expressions of antioxidants including HO‐1 (B) and NQO‐1 (C) by Real‐time PCR assay. Expressions of NRF2 (D and E) and its antagonist Keap‐1 (D and F) were also examined by Western blot assay to dissect the anti‐oxidative mechanisms of celecoxib in the hypertrophic heart. Data are presented as means ± S.D., n = 8 in each group. *P < 0.05 versus the SO group at 2‐week time‐point; € P < 0.05 versus the SO group at 4‐week time‐point; # P < 0.05 versus the CH group at 2‐week time‐point; £ P < 0.05 versus the CH group at 4‐week time‐point; & P < 0.05 versus the CH/celecoxib group at 2‐week time‐point.
