Figure 1.

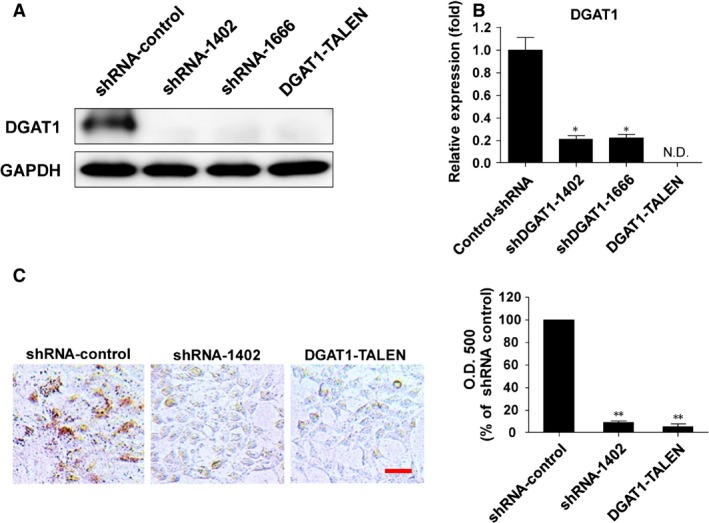
General characteristics of DGAT1‐deficient Huh‐7.5 cells. (A) DGAT1 protein level was examined by immunoblotting in DGAT1‐silenced cells and the control cell line. (B) DGAT1 mRNA level was determined by real‐time quantitative PCR in each cell line and normalized to β‐actin (n = 3). Data are presented as means ± S.E.M.; asterisks indicate significant differences by anova, **P < 0.01; N.D.: not detected. (C) Intracellular lipid droplets were quantitated using Oil‐red O staining in control and DGAT1‐silenced cells. OD values of eluted Oil‐red O with 100% isopropanol were measured and shown as with bar graphs; scale bar, 20 μm. Data are presented as means ± S.E.M.; asterisks indicate significant differences by anova, **P < 0.05.
