Figure 2.

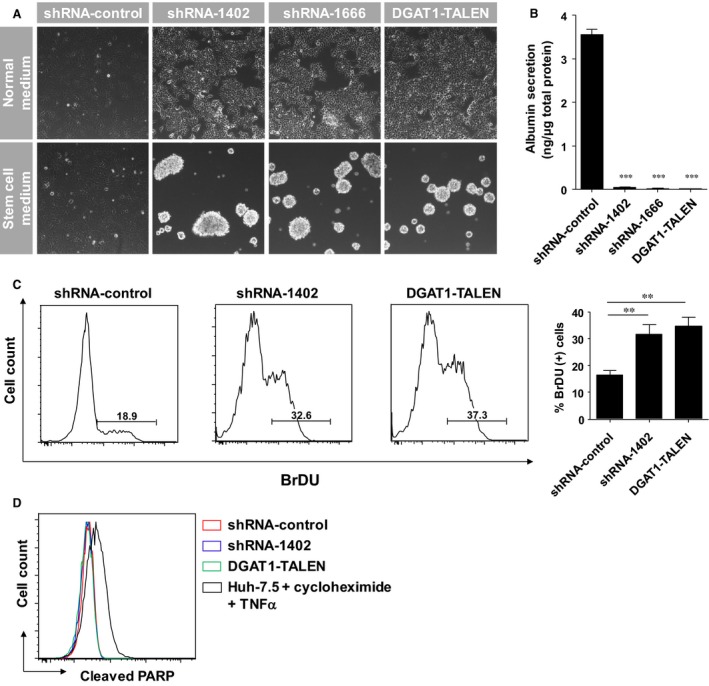
Phenotypic alterations caused by DGAT1 silencing in Huh‐7.5 cells. (A) DGAT1‐deficient cells and the control cell line were cultured in either complete medium or stem cell medium without serum. After 48 hrs incubation, cells were visualized using a phase‐contrast microscope. (B) The secreted albumin levels in the supernatants of each cell line after 24 hrs culture was determined by ELISA (n = 4). (C) Proliferation of each cell line was measured by BrdU incorporation assay. BrdU‐positive cells were counted by flow cytometry. Histograms are representative of three independent experiments and the proportions (%) of BrdU‐positive cells are shown as with bar graphs. (D) Histograms of cells expressing cleaved PARP are presented. A histogram of Huh‐7.5 cells treated with cycloheximide and TNFα is shown as a positive control. Data are presented as means ± S.E.M.; asterisks indicate significant differences by anova; **P < 0.01, ***P < 0.005.
