Figure 5.

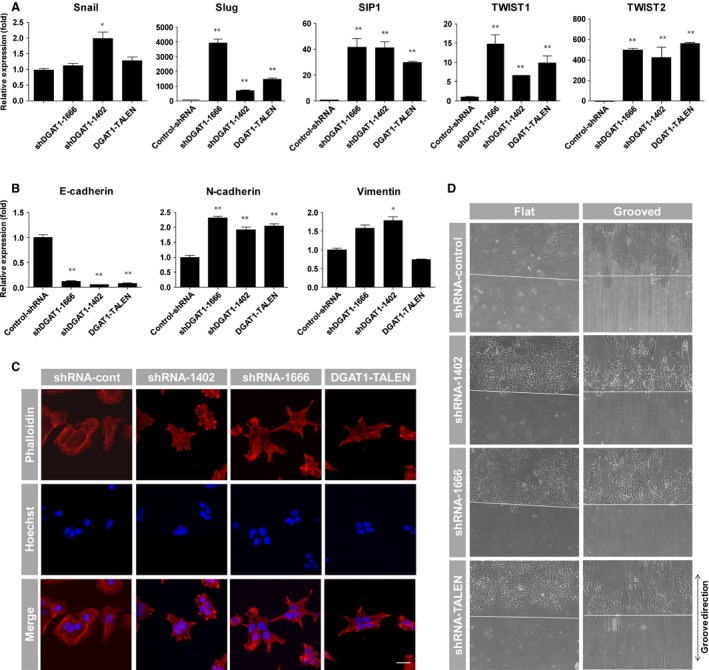
Verification of phenotype related to epithelial–mesenchymal transition. mRNA levels of transcription factors, including Snail, Slug, SIP1, TWIST1, TWIST2 (A) and E‐cadherin, N‐cadherin and vimentin (B) were examined by real‐time quantitative PCR in each cell line and normalized to β‐actin (n = 3). Data are presented as means ± S.E.M.; asterisks indicate significant differences by anova, *P < 0.05, **P < 0.01. (C) DGAT1‐silenced cell lines and the control cell line were fixed and stained for F‐actin (red) with rhodamine‐conjugated phalloidin; nuclei were stained with Hoechst 33342 (blue). Images of actin arrangement and nuclei were obtained by confocal and two‐photon microscopy; scale bar, 30 μm. (D) Flat and micropatterned PDMS substrates were prepared with an additional small piece of PDMS to generate a cell‐free area. Cells of each cell line were seeded and cultured on both flat and micropatterned substrates for 24 hrs; small PDMS pieces were then removed to induce cell migration. Images were acquired after an additional 24 hrs.
