Figure 6.

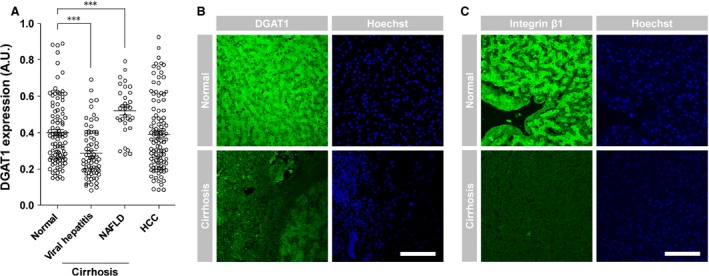
DGAT1 expression in human liver diseases. (A) DGAT1 mRNA levels in various liver diseases, including non‐alcoholic fatty liver disease (NAFLD)‐related cirrhosis, viral hepatitis‐related cirrhosis and hepatocellular carcinoma (HCC), were compared to those in the normal liver. DGAT1 expression was down‐regulated in viral hepatitis‐related cirrhosis (P < 0.001). Each mark indicates an mRNA level of a patient. Data are presented as means ± S.E.M.; asterisks indicate significant differences by Student's unpaired t‐test, ***P < 0.001. Tissue microarray slides containing normal livers and nodular cirrhotic livers without fatty degeneration were stained for DGAT1 (B) or integrin β1 (C) using Alexa Fluor 488 IgG (green); nuclei were stained with Hoechst 33342 (blue). Tissue IDs of Normal are Dlv06N007 and Dlv06N010 in each; Tissue IDs of Cirrhosis are Dlv062356 and Dlv051170 in each. Images of each sample were obtained by confocal and two‐photon microscopy. Scale bar, 500 μm.
