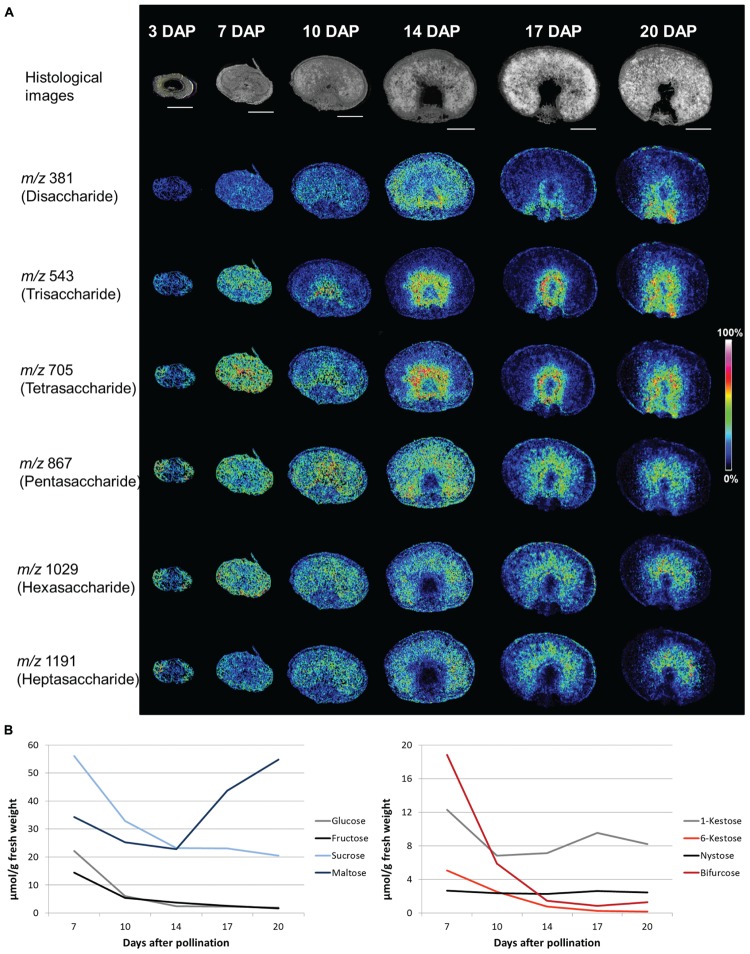
FIGURE 2.
Sugar contents in developing barley grains. (A) Accumulation patterns of oligosaccharides during barley grain development as observed by MALDI MSI. The top panel shows histological images illustrating the various developmental stages which were analyzed. The following panels show the ion intensity maps of the disaccharide (m/z of 381), the trisaccharide (m/z 543), the tetrasaccharides (m/z 705), the pentasaccharide (m/z 867), the hexasaccharide (m/z 1029), and the heptasaccharide (m/z 1191). Specific accumulation of the tri- and tetrasaccharides in and around the nascent endosperm cavity was observed from 10 DAP onwards. The penta-, hexa, and heptasaccharides, which accumulated in the pericarp during the prestorage phase (three DAP), moved to the endosperm at the beginning of the storage phase (from 10 DAP onwards). Bars = 1 mm. The images represent a reprint of Figure 2 and Supplemental Figure S2 from Peukert et al. (2014). (B) Quantities of sugars in total grains (μmol/g fresh weight). Hexoses (glucose and fructose) and sucrose decreased from 7 DAP until 20 DAP whereas maltose strongly increased (left diagram). For the oligofructans 6-kestose and bifurcose [both containing β(2,6)-linkages] a steep decline during the storage phase was observed. For the inulin-type oligofructans, 1-kestose and nystose, less pronounced changes were observed in the whole grain. Sugar quantities are graphically presented according to the data from Supplemental Table S1 of Peukert et al. (2014) (www.plantcell.org). Copyright American Society of Plant Biologists.

