
Figure 5.
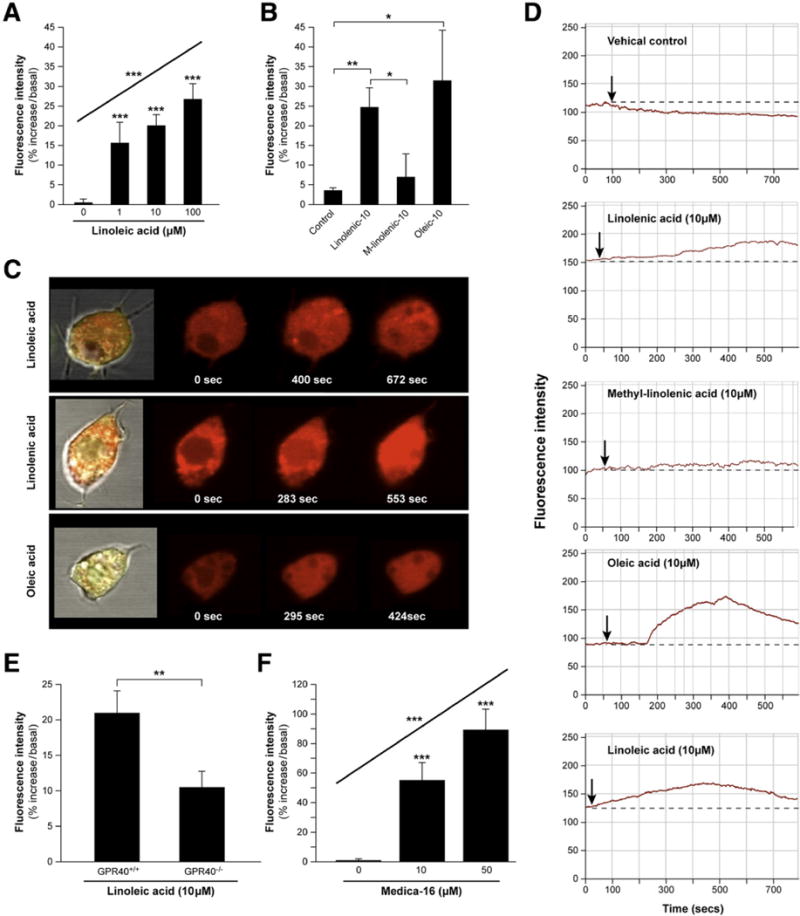
Long-chain fatty acid (LCFA) stimulated release of [Ca2+]i in fluorescence-activated cell sorting (FACS) isolated cholecystokinin (CCK-)–enhanced green fluorescent protein (eGFP) cells. (A) G-protein–coupled receptor 40 (GPR40)+/+ CCK-eGFP cells exhibit a dose-dependent response to linoleic acid (1–100 μM; n = 3–12 cells). (B) GPR40+/+ CCK-eGFP cell response to various LCFAs (all 10 μM; n = 6–7 cells). Representative (C) confocal images and (D) time-courses of isolated Quest Rhod4-loaded CCK-eGFP cell in response to various LCFAs. [Ca2+]i response to (E) linoleic acid (10 μM) in GPR40+/+ vs GPR40−/− CCK-eGFP cells (n = 10 cells, respectively), and (F) an increasing dose of the GPR40-selective agonist MEDICA 16 (0–50 μM) in GPR40+/+ CCK-eGFP cells (n = 3–12 cells). Changes in [Ca2+]i are expressed as mean ± standard error of mean of maximum percent increase in the fluorescence intensity (FI) of Quest Rhod4, relative to baseline. Cont, vehicle control. *P < .05; **P ≤ .001; ***P < .0001.