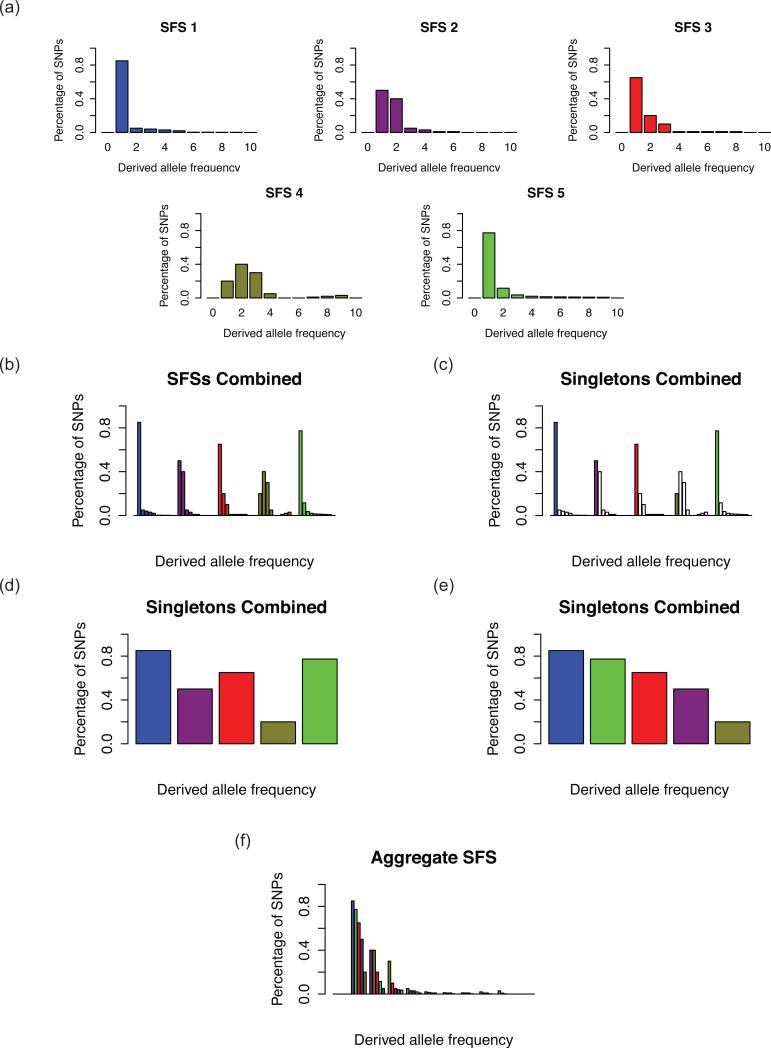
Figure 1. Constructing the aSFS.
(a) Five hypothetical SFSs are calculated from representational genomic data for five separate taxa of five diploid samples each (i.e. nine non-monomorphic frequency classes, or 11 total frequency classes). (b) The five SFSs are combined into one collated frequency spectrum. (c, d) First, only the singletons, or the first non-monomorphic bin, is focused upon. (e) The bin is rearranged in descending order of proportion or percentage of SNPs. (f) This is done for all bins to produce the aSFS.

