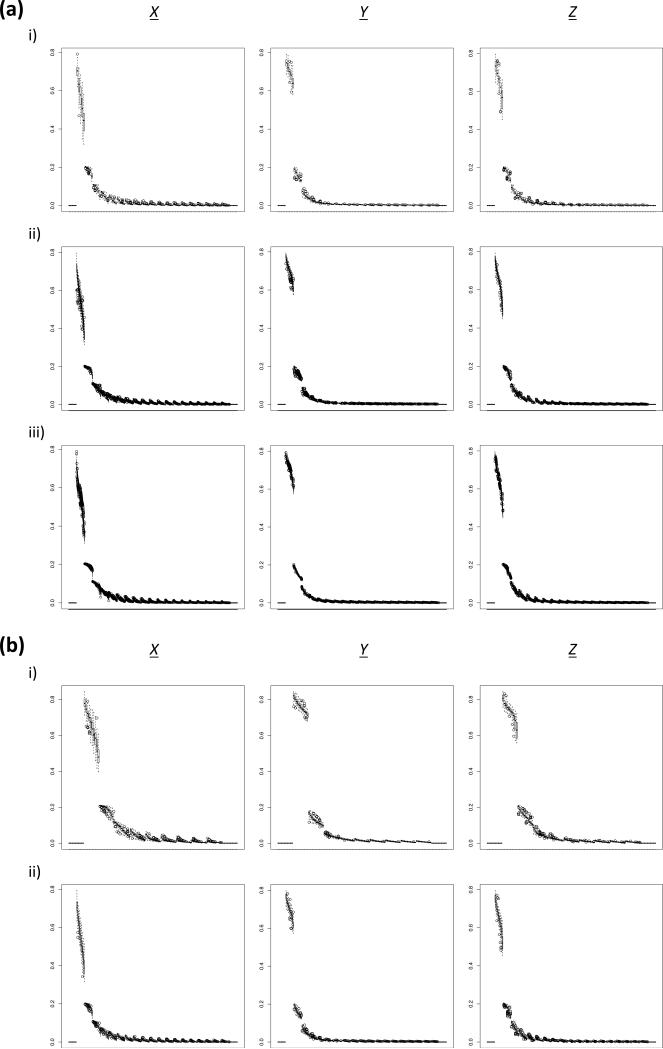
Figure 5. Boxplot of the simulated aSFS across 100 replicates among different sampling configurations.
Derived allele frequency bin is plotted on the x-axis and proportion of total SNPs is plotted on the y-axis. (a) Comparing differences between taxa amount at 20 haploids/taxon. Note that the characterization for synchronous expansion scenarios appreciably increased (i.e. decreased variance within scenarios) as number of taxa increased. i) 5 taxa (sampling configuration 2). ii) 20 taxa (sampling configuration 8). iii) 100 taxa (sampling configuration 14). X: ψ = 1; ζ = 0.0. Y: ψ = 1; ζ = 1.0. Z: ψ = 2; ζ1 = 0.5; ζ2 = 0.5. (b) Comparing differences between individuals/taxon sampling levels at 10 taxa. Note that the amount of within aSFS bin variance did not radically change as sampling increased. i) 10 haploids/taxon (sampling configuration 4). ii) 20 haploids/taxon (sampling configuration 5). X: ψ = 1; ζ = 0.0. Y: ψ = 1; ζ = 1.0. Z: ψ = 2; ζ1 = 0.5; ζ2 = 0.5.

