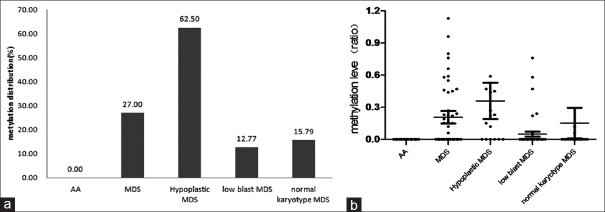
Figure 2.
The ID4 gene methylation distribution and levels of patients with aplastic anemia (AA) and myelodysplastic syndrome. (a) The ID4 gene methylation distribution in patients with AA and those with myelodysplastic syndrome (MDS). In the patients with AA, no methylation abnormalities in the ID4 gene were found; (b) ID4 gene methylation level of patients with AA and MDS. The methylation positivity rates (P = 0.000) and methylation levels (P = 0.000) of the ID4 gene were significantly different between patients with MDS and those with AA (0/31, 0 [0–0]).

