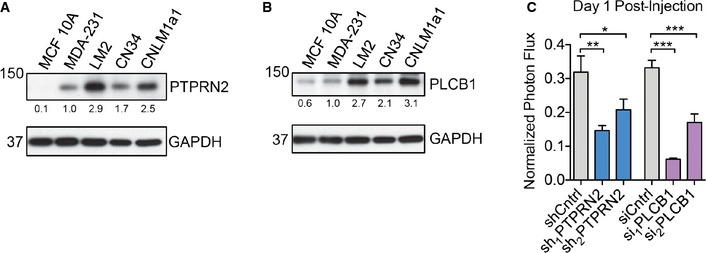
Figure EV1. PTPRN2 and PLCβ1 promote breast cancer metastasis.

-
A, BWestern blot analysis of MCF 10A, MDA‐MB‐231, LM2, CN34, and CNLM1a1 cell lysate using anti‐PTPRN2 (A) or anti‐PLCβ1 (B). GAPDH was used as a loading control. Densitometry analysis below the blots is adjusted for GAPDH levels and normalized to MDA‐MB‐231 values.
-
CBioluminescence imaging quantification of lung colonization 1 day after injection of 40,000 LM2 cells with knockdown of PTPRN2, PLCβ1, or control cells. For shCntrl, sh1PTPRN2: N = 5 mice/group. For sh2PTPRN2: N = 6 mice. For siCntrl: N = 5 mice. For si1PLCb1, si2PLCb1: N = 6 mice/group. Error bars represent SEM. *P < 0.05, **P < 0.01, ***P < 0.001.
