-
A
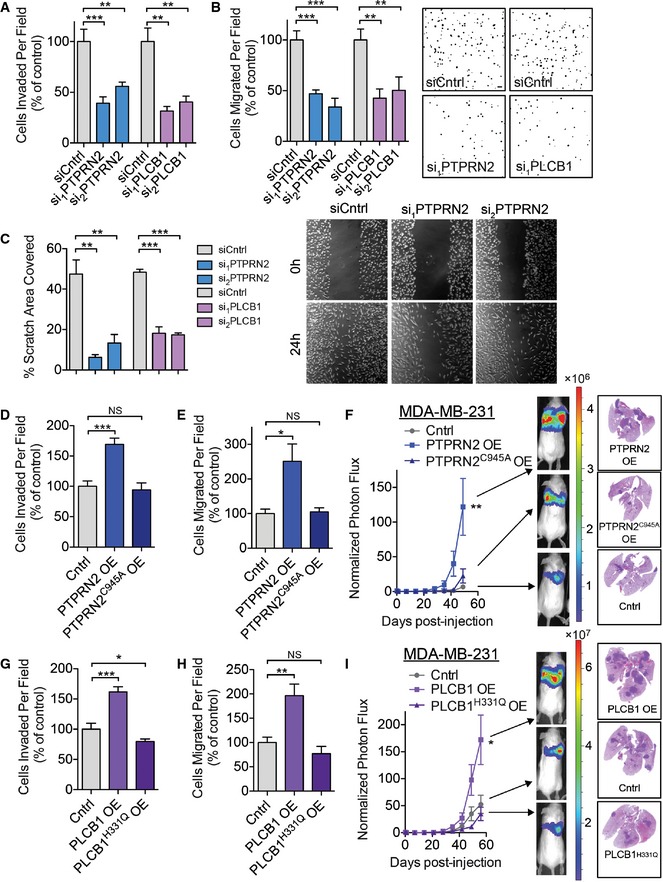
Matrigel invasion by 50,000 LM2 cells transfected with siRNA targeting PTPRN2, PLCβ1, or control siRNA. Data normalized to control values. N = 6 inserts/group.
-
B
Migration assay by 100,000 LM2 cells transfected with siRNA targeting PTPRN2, PLCβ1, or control siRNA. Data normalized to control values. N = 6 inserts/group. Right, representative images of the migration assay. Scale bar, 100 μm.
-
C
Quantification of area covered by cells 24 h after a scratch was made through confluent cells transfected with siRNA targeting PTPRN2, PLCβ1, or control siRNA. N = 5 wells/group. Right, representative images of the scratch assay.
-
D, E
MDA‐MB‐231 cells transduced with PTPRN2, PTPRN2C945A, or control vector were subjected to the Matrigel invasion (D) and migration assays (E). N = 5 inserts/group.
-
F
Bioluminescence imaging quantification of lung colonization by 40,000 MDA‐MB‐231 cells overexpressing PTPRN2, PTPRN2C945A, or control vector. N = 5 mice/group. Right, H&E staining of representative lung sections.
-
G, H
MDA‐MB‐231 cells transduced with PLCβ1, PLCβ1H331Q, or control vector were subjected to the Matrigel invasion (G) and migration assays (H). N = 5 inserts/group.
-
I
Bioluminescence imaging quantification of lung colonization by 40,000 MDA‐MB‐231 cells overexpressing PLCβ1, PLCβ1H331Q, or control vector. For Cntrl and PLCβ1H331Q
OE: N = 6 mice/group. For PLCβ1 OE: N = 5 mice. Right, H&E staining of representative lung sections.
Data information: Error bars represent SEM. *
< 0.001.

