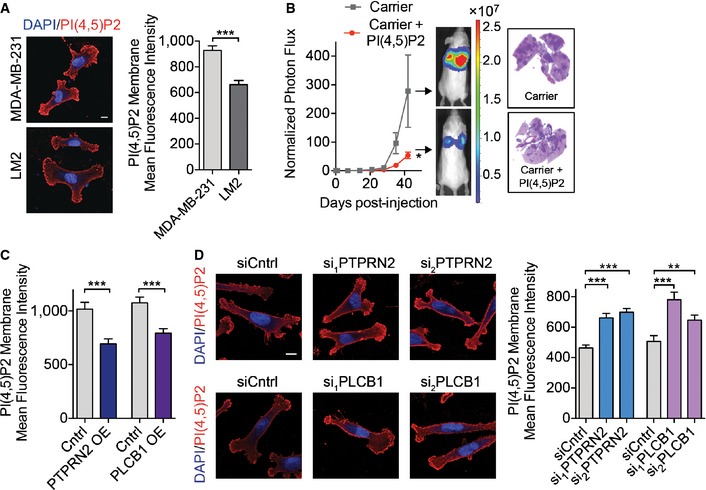
Figure 3. PLCβ1 and PTPRN2 regulate membrane PI(4,5)P2 levels.

-
AMean fluorescence intensity of membrane PI(4,5)P2 was analyzed in MDA‐MB‐231 and LM2 cells immunostained with anti‐PI(4,5)P2 antibody using fluorescence microscopy. N = 50 cells/group. Scale bar, 10 μm.
-
BBioluminescence imaging quantification of lung colonization by 40,000 LM2 cells treated with carrier incubated with PI(4,5)P2 or carrier alone for 1 h and then immediately injected. Right, H&E staining of representative lung sections. N = 6 mice/group.
-
C, DMDA‐MB‐231 cells overexpressing PTPRN2, PLCβ1, or a control vector (C) or LM2 cells transfected with siRNA targeting PTPRN2, PLCβ1, or a control siRNA (D) were immunostained for PI(4,5)P2 levels and analyzed by fluorescence microscopy. Mean fluorescence intensity of plasma membrane levels of the lipid was quantified. N = 50 cells/group. Left, representative immunofluorescence images of cells stained with anti‐PI(4,5)P2 antibody (red) and 4′,6‐diamidino‐2‐phenylindole (DAPI, blue). Scale bar, 10 μm.
