
Figure EV2. Analysed packed tissues largely hold to several geometrical laws.
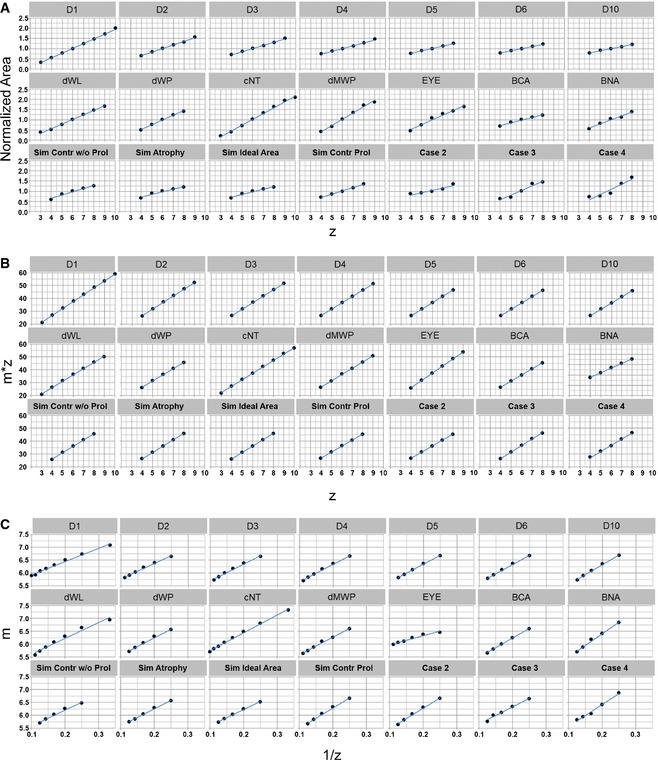
- Lewis' law. All samples show a linear relationship between cell area and the number of cell sides (z). Each solid point represents an average of cell areas across all samples. Blue lines show a linear fit to the data.
- Aboav–Weaire law. All samples show a linear relationship between the number of cell sides (z) and the product of this quantity with the average number of sides of a cell's neighbour (m). This demonstrates that all samples follow the predicted trend.
- To see whether there are any minor deviations from the Aboav–Weaire law, we plotted the inverse of the number of cell sides (1/z) against m. The slight curvature in the profiles demonstrates that there is in fact a minor deviation for most samples, which is consistent with previous studies of random Voronoi tessellations (Hilhorst, 2006).
Data information: In both (A) and (B), solid points represent averaged quantities across all samples, while blue lines show a linear fit to the data.