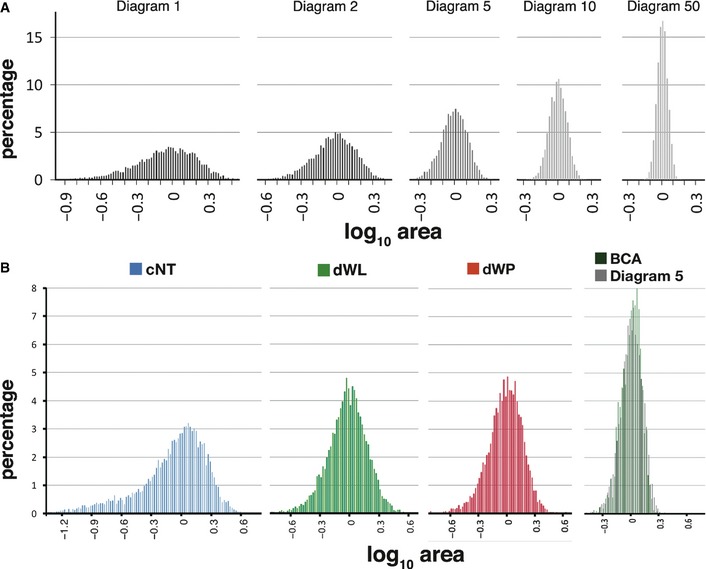
Figure 3. Relationship between area and polygon distribution.

- Area distribution of several Voronoi diagrams along the CVT path. Cell areas became progressively more homogeneous after each Lloyd iteration.
- Comparison of area distribution for proliferating epithelia cNT (blue), dWL (green) and dWP (red). At the right of the image biceps (green) and Diagram 5 (grey) images.
