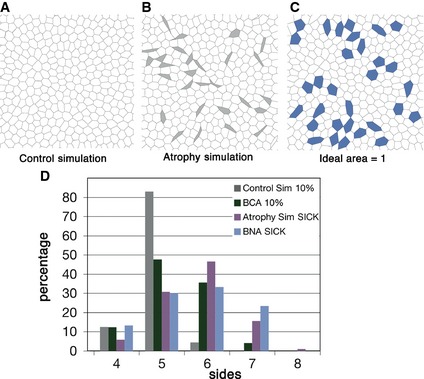
Figure 6. Computer simulations indicate that changes to homogeneous resting areas are able to alter cell topology.

- Diagram resulting from a vertex model simulation with homogeneous parameters for contractility, line tension and ideal area.
- Diagram resulting from a vertex model simulation where in ten percentage of the cells (grey), the line tension and ideal area parameters were reduced.
- Control diagram where in the ten percentage of the cells (blue) only line tension parameter was reduced.
- Comparison of polygon distribution for the 10% smallest cells from BCA (green bar) and control simulation (grey bar) with the sick cells from BNA (light blue bar) and atrophy simulation (grey cells from (B), purple bar).
