
Fig. 2.
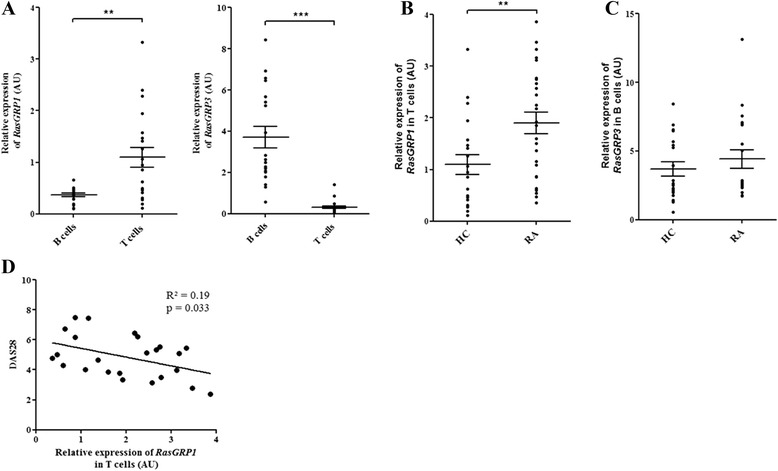
RasGRP1 and RasGRP3 gene expression levels in B and T cells from healthy controls and patients with rheumatoid arthritis (RA). After T and B cell negative selection, quantitative PCR analysis of RasGRP1 and RasGRP3 gene expression was performed. a RasGRP1 and RasGRP3 gene expression levels in B and T cells from healthy controls (HC) (n = 20; 6 male and 14 female; 32 ± 9 years old). b RasGRP1 and c RasGRP3 gene expression levels respectively in T and B cells from HC (n = 20; 6 male and 14 female; 32 ± 9 years old) and patients with RA (n = 26; 8 male and 18 female; 53 ± 15 years old). d Correlation between RasGRP1 gene expression level in T cells and RA disease activity (disease activity score in 28 joints (DAS28)) was assessed using Pearson’s rank correlation coefficient. The relative expression levels (in arbitrary units (AU)) of RasGRP1 and RasGRP3 were normalized with 18S RNA abundance. Mean ± standard error of the mean were compared using the Wilcoxon paired test or one-way analysis of variance followed by Dunnett post-hoc test. * p < 0.05; ** p < 0.01; *** p < 0.001