
Fig. 4.
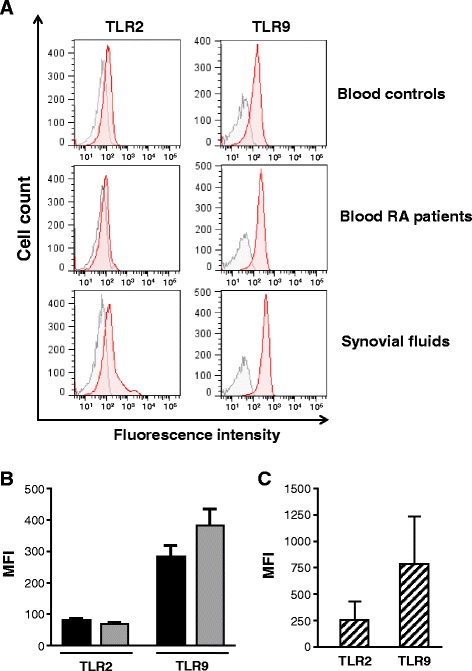
Expression of toll-like receptor 2 (TLR2) and TLR9 in neutrophils of rheumatoid arthritis (RA) patients. a Flow cytometry analysis of TLR2 and TLR9 expression in neutrophils isolated from blood of healthy controls and RA patients and synovial fluids of RA patients. TLR2 and TLR9 expression is represented by red histograms whereas negative control is represented by gray histograms. Data are neutrophils of representative donors. b TLR2 and TLR9 expression on blood neutrophils from healthy controls and RA patients are presented as mean fluorescence intensity (MFI) (mean ± standard error of the mean (SEM)). Black bars healthy donors, gray bars RA patients . c TLR2 and TLR9 expression on synovial fluid neutrophils from RA patients are presented as MFI (mean ± SEM). Striped bars RA patient synovial fluids