Figure 2.

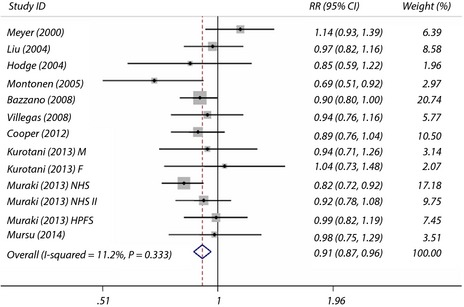
Maximum‐adjusted relative risk (RR) for type 2 diabetes, comparing highest vs lowest intake of fruit. Weights are from fixed effect analysis. CI, confidence interval.

Maximum‐adjusted relative risk (RR) for type 2 diabetes, comparing highest vs lowest intake of fruit. Weights are from fixed effect analysis. CI, confidence interval.