Figure 6.

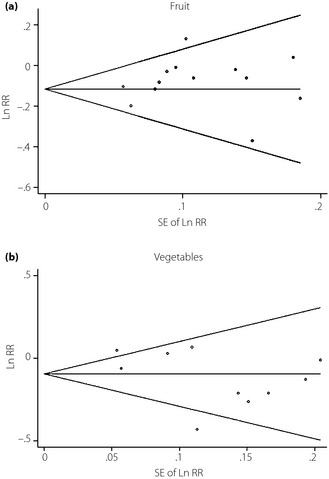
Publication bias was analyzed using funnel plot. (a) Fruit. (b) Vegetables. SE of Ln RR, standard error or natural logarithm of relative risk.

Publication bias was analyzed using funnel plot. (a) Fruit. (b) Vegetables. SE of Ln RR, standard error or natural logarithm of relative risk.