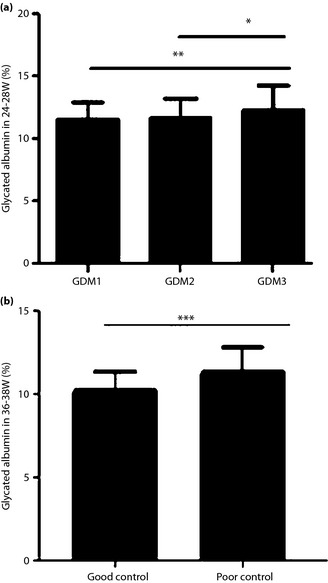
Figure 2.

A comparison of the glycated albumin values in different gestational diabetes mellitus (GDM) groups. (a) The different severity of GDM at 24–28 weeks. (b) The status of the glycemic control in GDM patients at 36–38 weeks: good and poor glycemic control. A P‐value of <0.05 is considered to be statistically significant. *P < 0.05; **P < 0.01; ***P < 0.001. GDM1, participants with one abnormal oral glucose‐tolerance test value; GDM2, participants with two abnormal oral glucose‐tolerance test value values; GDM3, participants with three abnormal oral glucose‐tolerance test values. W, weeks of gestation.
