
Figure 3.
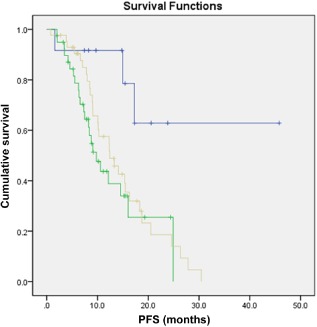
Kaplan–Meier survival curves of the three terminal subgroups generated from classification and regression tree analysis. Group: ( ) 1.00, (
 ) 3.00, (
 ) 4.00, (
 ) 1.00‐censored, (
 ) 3.00‐cnesored, (
 ) 4.00‐censored. Node 1: body mass index (BMI) less than or equal to 20.768 kg/m2. Node 3: BMI greater than 20.768 kg/m2 and without exon 19 mutation. Node 4: BMI greater than 20.768 kg/m2 and with exon 19 mutation.