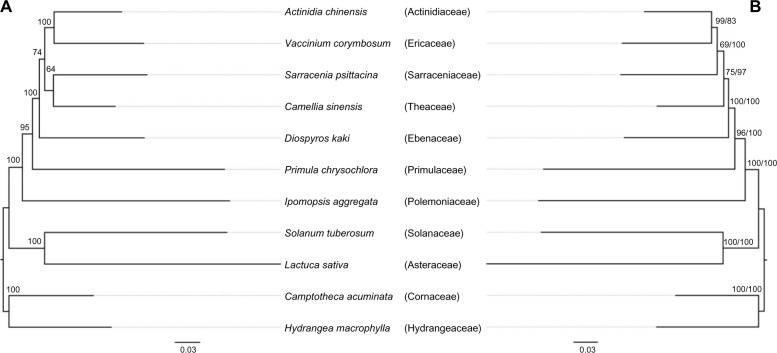
Figure 2.
The species trees yielded with dataset M (100 genes with medium evolving rates).
Notes: (A) The species tree yielded by unpartitioned ML analysis. Values above branches indicated the corresponding BSV. (B) The species tree yielded by partitioned ML analysis based on genes. Values above branches indicated the BSV of partitioned ML analysis and MP-EST analysis.

