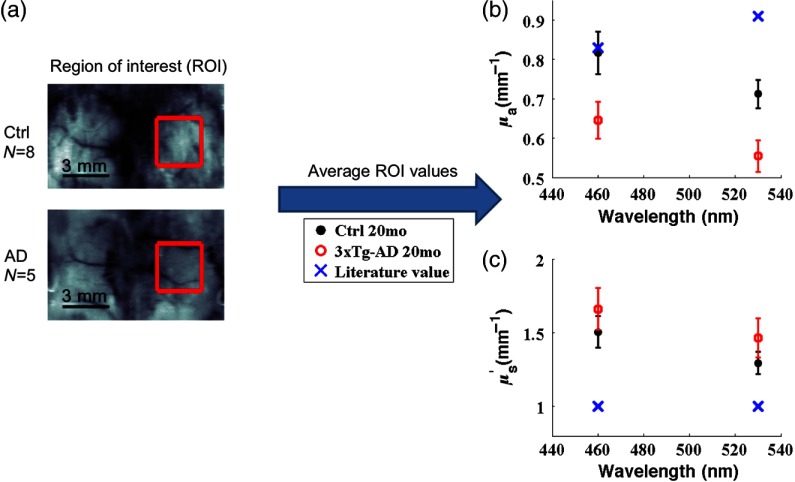
Fig. 2.
Spatial frequency domain imaging (SFDI)-measured and are different from literature-reported values at 460 and 530 nm. (a) A region of interest (ROI, red square) was selected over the contralateral somatosensory cortex of the stimulated hindlimb. (b) The average and standard error of ROI values in each group are shown for and compared to a literature-reported value.37 (c) The average and standard error of ROI values in each group are shown for and compared to a typically assumed literature-reported value of .38

